
You’re running a retail store. You’re busy. And somewhere inside your Lightspeed Retail system, there’s a goldmine of data about your customers, your inventory, and your sales — sitting completely untouched.
Most retailers check their end-of-day totals. Maybe a weekly sales report. And that’s about it.
But the stores pulling ahead right now? They’re asking their data better questions. More specific questions. Questions that actually drive decisions.
Here are the 5 most valuable questions you should be asking your Lightspeed Retail data — and why most retailers never think to ask them.
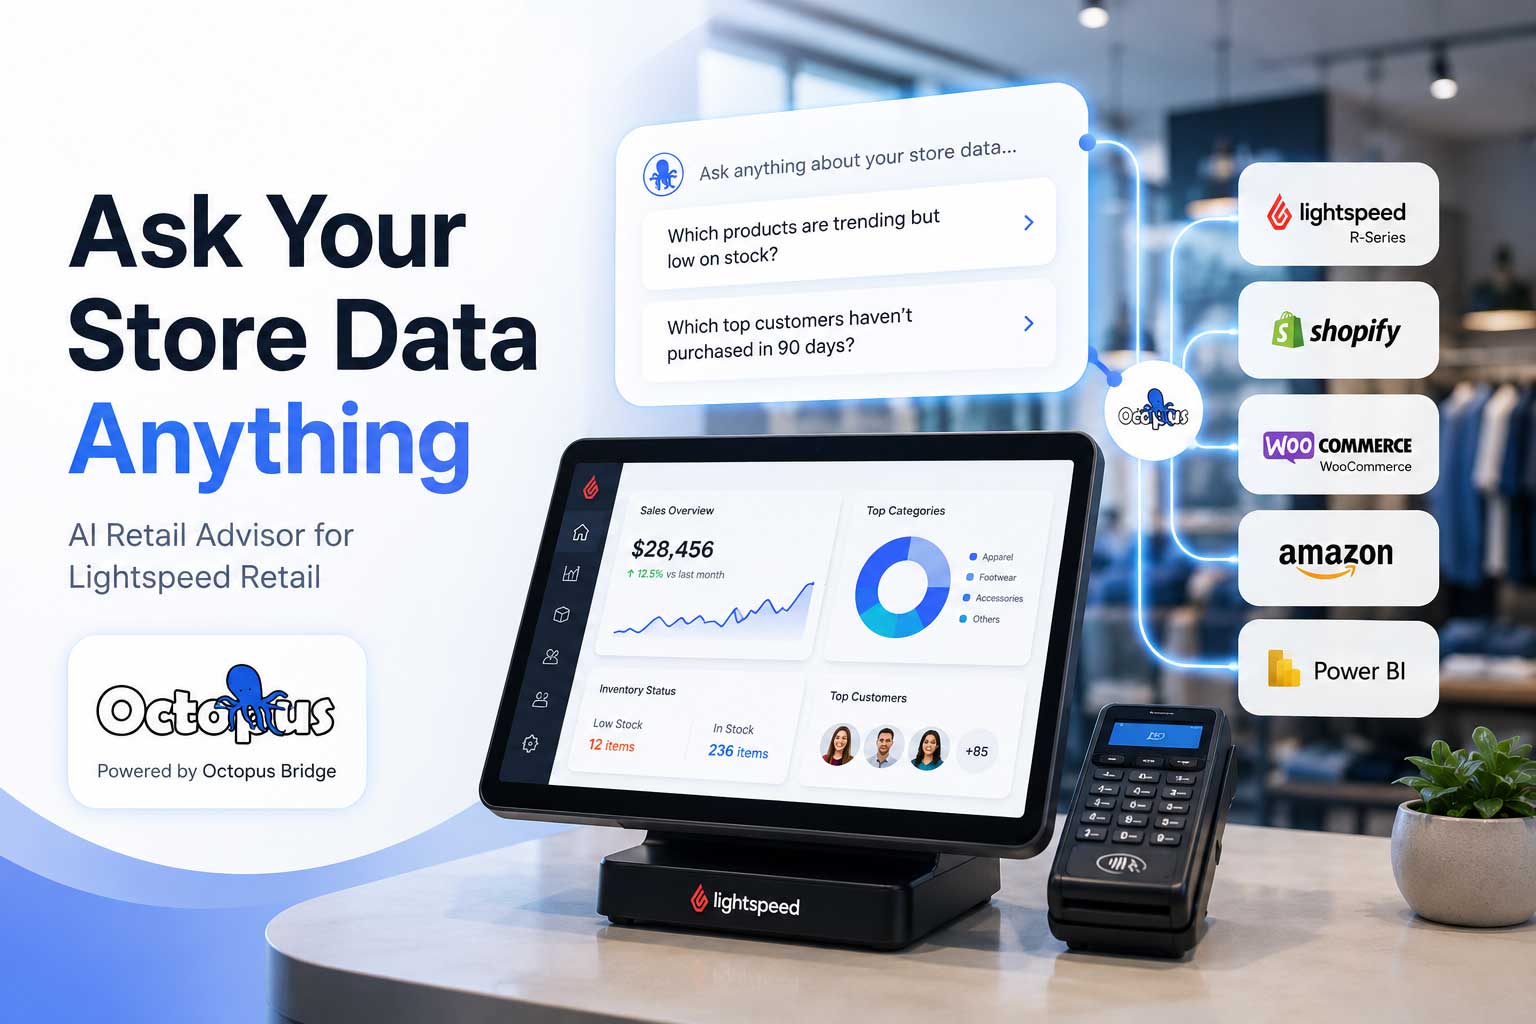
Question 1: “Which products are trending up but running low on stock?”
This is the question worth the most money — and the one almost nobody asks until it’s too late.
Here’s the problem: your best-selling item this weekend could be completely out of stock by Monday if you’re not watching the right signals. Standard inventory alerts tell you when you’ve hit zero. But by then, you’ve already lost sales.
What you actually want to know is: which products are selling faster than usual AND are approaching low stock at the same time?
That’s two data points cross-referenced — trending velocity against current stock levels. When you catch that combination early, you can reorder before the rush instead of apologizing to customers after it.
What to do with this: Check it every Monday morning. Treat it like a weather forecast for your week.
Question 2: “What’s my best-selling category this month compared to the same time last year?”
Single-month sales numbers lie to you.
A great October doesn’t mean much if last October was even better. A slow January might actually be your best January ever. Without year-over-year comparison, you’re reacting to noise instead of real trends.
Category-level comparison is especially powerful because it tells you where your business is growing or shrinking — not just whether overall revenue is up or down.
For example: your total sales might be flat, but if footwear is up 30% and accessories are down 40%, those are two completely different business decisions hiding inside one boring number.
What to do with this: Look at your top 5 categories year-over-year every month. Move budget, floor space, and marketing toward what’s actually growing.
Question 3: “Which SKUs haven’t sold in the last 60 days?”
Dead stock is one of the most expensive silent problems in retail.
It ties up cash. It takes up shelf space. It ages. And most retailers don’t catch it until they’re doing a full stocktake at the end of the year — by which point, the damage is done.
60 days without a single sale is a clear signal. It could mean the product is priced wrong, positioned badly, or simply not something your customers want. Whatever the reason, you need to know about it now — not in six months.
The good news: slow-moving stock can often be cleared quickly with a small discount, a bundle offer, or simply moving it to a more visible location. But only if you catch it early.
What to do with this: Run a 60-day no-sale report once a month. Create a clearance or bundle strategy for anything on the list. Free up that cash and shelf space for products that actually move.
Question 4: “What’s my actual margin by product category?”
Revenue is vanity. Margin is sanity.
Most retailers know their rough margin. But very few know it broken down by category — and that’s where the real insight lives.
You might be surprised to find that your highest-revenue category is actually your least profitable one. Or that a quiet, low-volume category is quietly delivering your best margins. Without this breakdown, you’re investing time, floor space, and marketing budget based on top-line numbers that don’t tell the full story.
Knowing your margin by category also changes how you approach promotions. Discounting a high-margin product is a very different decision than discounting a low-margin one — even if the sale price looks the same.
What to do with this: Pull a margin report by category every quarter. Rank your categories by profitability, not just revenue. Let that ranking guide where you put your energy.
Question 5: “Who are my top 20% of customers and when did they last buy?”
In most retail stores, roughly 20% of customers generate 80% of revenue. That’s not a theory — it’s a pattern that shows up consistently across independent retail.
Do you know who those customers are in your store?
More importantly — do you know which of them haven’t been in recently?
A loyal customer who used to shop monthly and hasn’t visited in 90 days isn’t gone yet. But they’re drifting. A well-timed message, a personal thank-you, or an exclusive offer can bring them back before a competitor wins them over for good.
This is the question that turns your existing customer data into a retention machine. You don’t need a big marketing budget to act on it. You just need to know who to reach.
What to do with this: Every month, pull your top customers by lifetime spend. Flag anyone who hasn’t purchased in 60-90 days. Reach out personally — a simple email or SMS goes a long way.
Why Most Retailers Don’t Ask These Questions
It’s not laziness. It’s friction.
Getting answers to these questions in most retail systems means pulling multiple reports, exporting to spreadsheets, cross-referencing data manually, and spending 30-60 minutes to find one number. Most store owners simply don’t have that time in their day.
That’s the real barrier. Not a lack of data — a lack of easy access to it.
The retailers who are pulling ahead aren’t necessarily smarter or more analytical. They just have faster access to answers.
The Shift Happening in Retail Right Now
A new category of tools is emerging that lets retailers ask these questions — and get answers — in plain English. No reports to build. No spreadsheets to wrestle. Just type what you want to know and get a clear, data-backed answer in seconds.
Think of it like having a ChatGPT that’s trained entirely on your own store’s data.
AI Retail Advisor by Octopus Bridge does exactly this for Lightspeed R users. Connect your store, ask any of the five questions above, and get an answer immediately — without touching a single report.
We’re currently offering free beta access to a limited group of Lightspeed R retailers.
Learn more and claim your free beta spot →
Quick Reference: Your Monthly Data Checklist
Use this as a starting point every month:
- Which products are trending up but running low on stock?
- How does my top category performance compare to this time last year?
- Which SKUs haven’t sold in 60+ days?
- What is my actual margin by category — not just revenue?
- Which top customers haven’t purchased in the last 60-90 days?
Five questions. Thirty minutes a month. The difference between running your store on gut feel and running it on data.
About 24Seven Commerce
24Seven Commerce builds middleware and AI tools that connect retail point-of-sale systems — including Lightspeed R — with eCommerce platforms, marketplaces, and business intelligence tools. Our AI Retail Advisor is designed specifically for independent and multi-location retailers who want faster, smarter access to their own store data.